This article originally appreared on the Financial Express.
Contrary to the claims made by the Delhi government, air pollution in the city has deteriorated significantly since 2012.
There is an irony being played out in Delhi. While the national capital is reeling under one of its worst spells of air pollution, the Delhi government is bringing out a series of advertisements claiming that the pollution levels are down by 25%.
The advertisements mention that the levels of PM 2.5—particulate matter of size less than 2.5 microns—have reduced from 154 microgrammes per cubic meter (µg/m3) during 2012-2014 to 115 µg/m3 during 2016-2018. If this claim is valid, then we are on the right path, and we should continue with the current action plan to control air pollution. If it is not, then we should seriously change track and develop a new blueprint.
To understand the exact situation of pollution in the city, one has to understand the status of air pollution monitoring. Delhi has the largest number of air quality monitors in the country—47 monitoring stations, to be precise. Out of these, 10 are manual monitors, and 37 are continuous monitors. Four agencies own these monitors—the Central Pollution Control Board (CPCB) has 13 monitors, Delhi Pollution Control Committee (DPCC) has 24, India Meteorological Department (IMD) has 7 monitors, and the National Environmental Engineering Research Institute (NEERI) has 3.
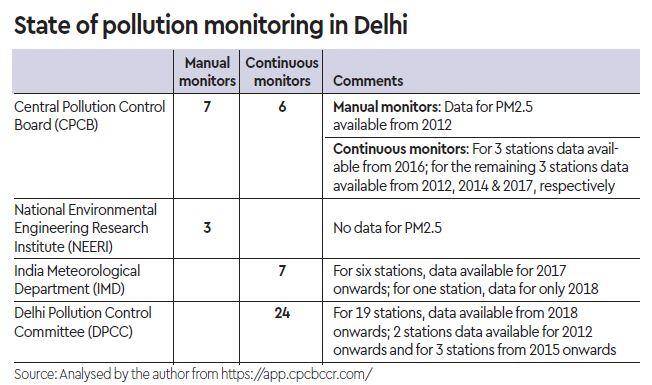
Continuous monitors give pollution readings every 15 minutes, and these are used for calculating the Air Quality Index (AQI). CPCB has developed data validation criteria for these monitors. For example, continuous monitors must be operational for 16 hours in a day for estimating daily pollution levels. Similarly, they must be operational for 80% of the time in a year for determining the annual pollution levels.
In manual monitors, the monitoring is carried out for 24 hours, with a frequency of twice a week. There must be a minimum of 104 readings in a year for estimating annual pollution levels. In India, data from manual monitors are still used to make country-wide comparisons on the status of air pollution. The reason is simple: we have 573 manual stations in 240 cities/towns compared to just 202 continuous monitors in 112 cities/towns. Manual monitors, therefore, are sentinel monitors as they have comparable data for the longest time-frame.
As one can see in the accompanying graphic, continuous monitoring is a recent phenomenon in Delhi. Twenty continuous monitors were installed in 2018, and seven were introduced in 2017. We have data from only four monitors for 2012 onwards. But, there are significant data gaps from these four monitors. For instance, the Dilshad Garden monitoring station had correct data for only 32 days for 2013; the ITO station has data for less than 50% of the time for 2012, 2014, and 2016; and RK Puram has no data for 2013, and 2014. Most researchers have concluded that using data from the continuous monitors to estimate annual pollution levels for the years 2012 to 2016 is statistically wrong. Therefore, one has to rely on manual monitors to establish whether the pollution status has improved or deteriorated since 2012.
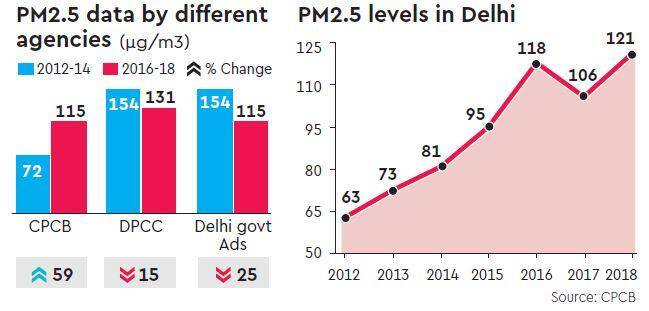
The data from manual monitors, published by CPCB, shows that the amount of PM 2.5 has almost doubled between 2012 and 2018—from 63 µg/m3 in 2012 to 121 µg/m3 in 2018. The average PM 2.5 level during 2012-2014 was 72 µg/m3, and during 2016-18, it was 115 µg/m3—an increase of 59%. So, air pollution levels in Delhi have increased significantly, and not reduced. From where, then, has the Delhi government put together data to show a reduction of 25%? Interestingly, there is another set of data put out by DPCC, which is less publicised. This DPCC data shows that the average level of PM 2.5 was 154 µg/m3 during 2012-14, which reduced to 131 µg/m3 during 2016-2018—a reduction of 15%. DPCC data, however, comes with a disclaimer. It clearly states that for the period 2012-2017, the data is based on four continuous monitors, and the 2018 information is based on 26 monitors. As explained above, the data from the four continuous monitors are incomplete. They cannot be the basis for estimating pollution levels during the 2012-2017 period. Even if we had complete data from the four continuous monitors, comparing data of four monitors with that from 26 monitors is highly spurious. It will not stand even the basic statistical scrutiny.
Nevertheless, let’s take the DPCC data with a pinch of salt, and put it together with the CPCB data. We can see, in the accompanying graphic, where the mistake has happened. The Delhi government has taken continuous monitoring data of DPCC for the period 2012-2014 and manual monitoring data of CPCB for the period 2016-2018 to claim that air pollution reduced by 25%. This is cherry-picking, and completely wrong. These types of analyses cannot be the basis for decision-making.
Let me end by saying that I support CM Arvind Kejriwal on stubble burning. He is absolutely right that the spike in pollution post-Diwali is because of stubble burning. One can smell biomass burning in the air, and we need to do something about this urgently. But, he is wrong to claim that his actions have led to a 25% reduction in pollution levels. Instead of putting out wrong information, it is important that his government goes back to the drawing board and develops a new blueprint for saving this historical city from Airpocalypse.
Chandra Bhushan is one of India’s foremost public policy experts and the founder-CEO of International Forum for Environment, Sustainability & Technology (iFOREST).
Despite the Delhi government’s claims of a 25% reduction in PM2.5 levels, air pollution in the city has worsened since 2012. While advertisements tout improvements, actual conditions suggest the problem remains severe. If the data is accurate, current measures may be working, but if not, a new, more effective strategy is urgently needed to tackle Delhi’s air quality crisis.